
[embedded content]
It was only a few weeks ago that FreightWaves founder and CEO Craig Fuller introduced several new SONAR features as part of the SONAR 7.0 release. One new feature was the “Ocean Shipments Report, which shows U.S. import and export shipment volumes for ocean containers seven days into the future,” Fuller stated on July 21.
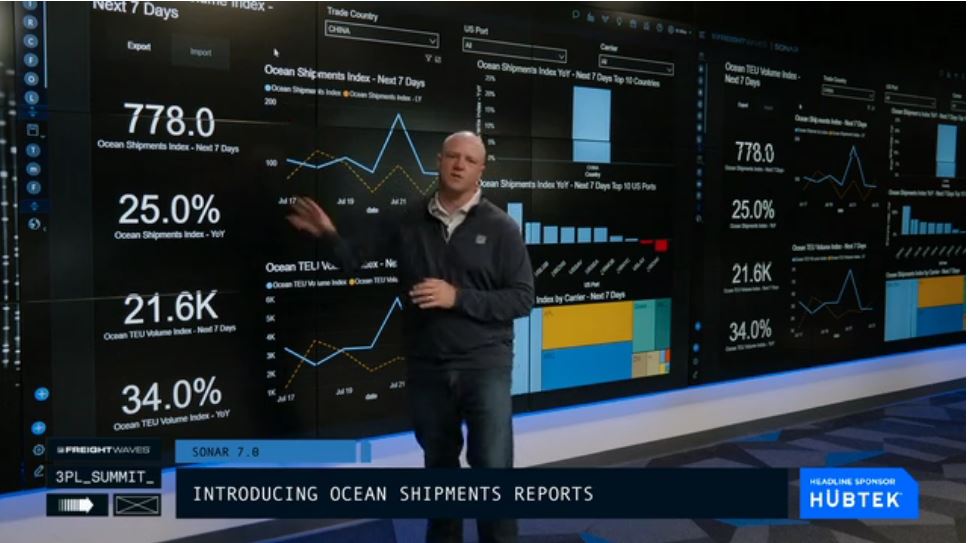
On September 16 during the first day of the American Shipper Global Trade Tech Summit, Fuller previewed several new enhancements related to ocean freight, including a new dashboard that showcases numerous data sets in easy-to-see and understand graphics. Most importantly, the data in SONAR’s Ocean Shipments Report app can help companies in all modes “read the future” and know where freight will be coming into the U.S., when and in what volume.
Ports are critical to U.S. economy
As Fuller stated, “U.S. ports are where nearly all transportation modes come together – ships, drayage vehicles, intermodal rail and trucks – moving the imports that are the lifeblood of the American economy.” And now this proprietary data that is unique to SONAR is displayed like never before.

In addition to the dashboard, another new feature lets a SONAR subscriber see which companies are the 100 largest consignees by shipment volume – as well as where the imports are coming from and where in the United States those shipments are heading. Fuller and FreightWaves analyst Zach Strickland discussed the Ocean Shipments Reports and what they can do for freight analysis and forecasting across all modes. In the video segment embedded in this article (above), readers can see the entire presentation.
SONAR showcases the future movement of freight
With the new dashboard, it is easy to see why the SONAR Ocean Shipments Report is the best indicator available to gauge how much ocean container volume is being booked for U.S. imports. A SONAR subscriber has the ability to see exactly where ocean container volumes are loading and in what volume. SONAR is the only data platform in the world that has this data set. It is located under the apps in SONAR and provides subscribers new visualizations of maritime container flow and also give them the opportunity to plan for future trucking and/or intermodal activity at various U.S. ports.

Viewing the Monthly Customs Shipments for example, the latest data shows that in August, more than one-third (33.4%) of all the ocean-borne imports into the U.S. came from just one country – China! Moreover, goods moving from China next week will be up 121% year-over-year – even though companies have worked to move manufacturing and supply chains out of China for the past year.
Prior to the pandemic, most analysts predicted a flat or declining freight market for the remainder of 2020. Fuller saw things differently, and foretold of a good year for freight. No one saw the pandemic coming or its impact on freight, but Fuller was one of the few that predicted a bullish year.

Strickland pointed out that the Ocean Shipments Report is a robust “market intelligence product for the global freight market.” He showed how SONAR can show not only import volume (in total and by U.S. port), but which ocean carriers are being used to carry freight – from which countries and in what volume. Strickland also noted that shipments are classified and counted as the total number of bills of lading moving in the next seven days. This is the total number of shipments, and there can be multiple containers per shipment. For that reason, SONAR’s Ocean Shipments Report has another chart showing pure container volumes measured in twenty-foot equivalent units (TEUs). This represents the total number of containers being moved in the lowest common denominator, which is a TEU.
Fuller asked the rhetorical question of why would companies in the U.S. care about high-volume importers (consignees) or about import activity in general? He then explained why this was so important for U.S.-based transportation providers. “If you see this information in SONAR – a week before other providers – then you can get ahead of your competitors by knowing the volume of what will be arriving in the U.S., as well as when and where. And when that freight reaches the U.S., it will need to be moved – perhaps to nearby warehouses, or perhaps to the other side of the country. That is actionable intelligence, which is the essence of SONAR!”
Again, a SONAR subscriber can view U.S. port-level specifics for both U.S. imports and exports. For example, if a subscriber has set a filter to the Port of Los Angeles, then the ocean container volumes that are destined for the Port of Los Angeles are displayed – before they ever leave the countries of origin. Therefore, a SONAR subscriber has a 14- to 30-day heads-up on how much volume can be expected to arrive into the Port of Los Angeles in the next 14 to 30 days (the timing is variable because of the different transit times of the ocean vessels to the Port of Los Angeles).

How the Ocean Shipments Report adds value to plan for capacity and rates
The Ocean Shipments Report provides leading indicators for the ocean container industry as well as for anyone involved in the domestic U.S. port, intermodal or trucking markets.
As outlined above, a SONAR subscriber can view ocean container volumes seven days into the future on both containerized U.S. imports and exports. The date is based on the date that the volumes are set to leave the country of origin. If a SONAR subscriber is looking at U.S. imports, then those would be leaving from countries such as China, India or Vietnam. Conversely, if a subscriber was looking at exports, then the dates would represent the volumes leaving U.S. ports for export to other countries.
The Ocean Shipments Report also enables a SONAR subscriber involved in moving ocean container shipments to see how volumes are shifting relative to demand this year compared with demand for last year. If volumes this year are above where they were last year, then capacity can be expected to be relatively tight on specific trade lanes, and ocean rates are likely to go up. Conversely, if demand is down on a particular lane compared to last year, then it can be expected that there is an oversupply of capacity, which should put downward pressure on rates.
